How I Used First-Party Data to Get 303 Press Pickups and a Backlink from AP News
February 8, 2025
Most startup founders think backlinks come from one of three places: guest posting on someone else's blog, paying an agency to spam journalists, or writing something so brilliant it goes viral on its own. The first one trades your time for links on sites nobody reads. The second one trades your money for links that Google will eventually penalize. The third one trades your sanity for a lottery ticket.
There is a fourth option that almost nobody in the startup world talks about, and it is by far the most effective backlink strategy I have ever used. It requires no outreach. No relationship-building with journalists. No begging editors for a guest post slot. No link exchanges. No buying expired domains. None of that.
The strategy is simple: create original research using first-party data, package it as a press release, and distribute it through a wire service.
I know what you are thinking. Press releases? In 2026? That sounds like something a Fortune 500 company does when they hire a new CFO. And you would be mostly right. Most press releases are terrible. They announce things nobody cares about, they are written in corporate jargon that makes your eyes glaze over, and they get picked up by zero publications because there is nothing newsworthy about your Series A funding round or your new product feature.
But a press release built around original data is a completely different animal. Journalists are desperate for data. Every newsroom has been gutted over the past decade, and the reporters who remain do not have time to conduct their own research. When you hand them a story that is already backed by numbers, already written in a quotable format, and already structured with a clear narrative, you are doing 80% of their job for them. They will pick it up not because they are doing you a favor, but because it makes their lives easier.
Here is the proof. In January 2026, I published a data study analyzing 83,670 AI citations across ChatGPT, Claude, and Perplexity. I distributed it through EIN Presswire for $99.
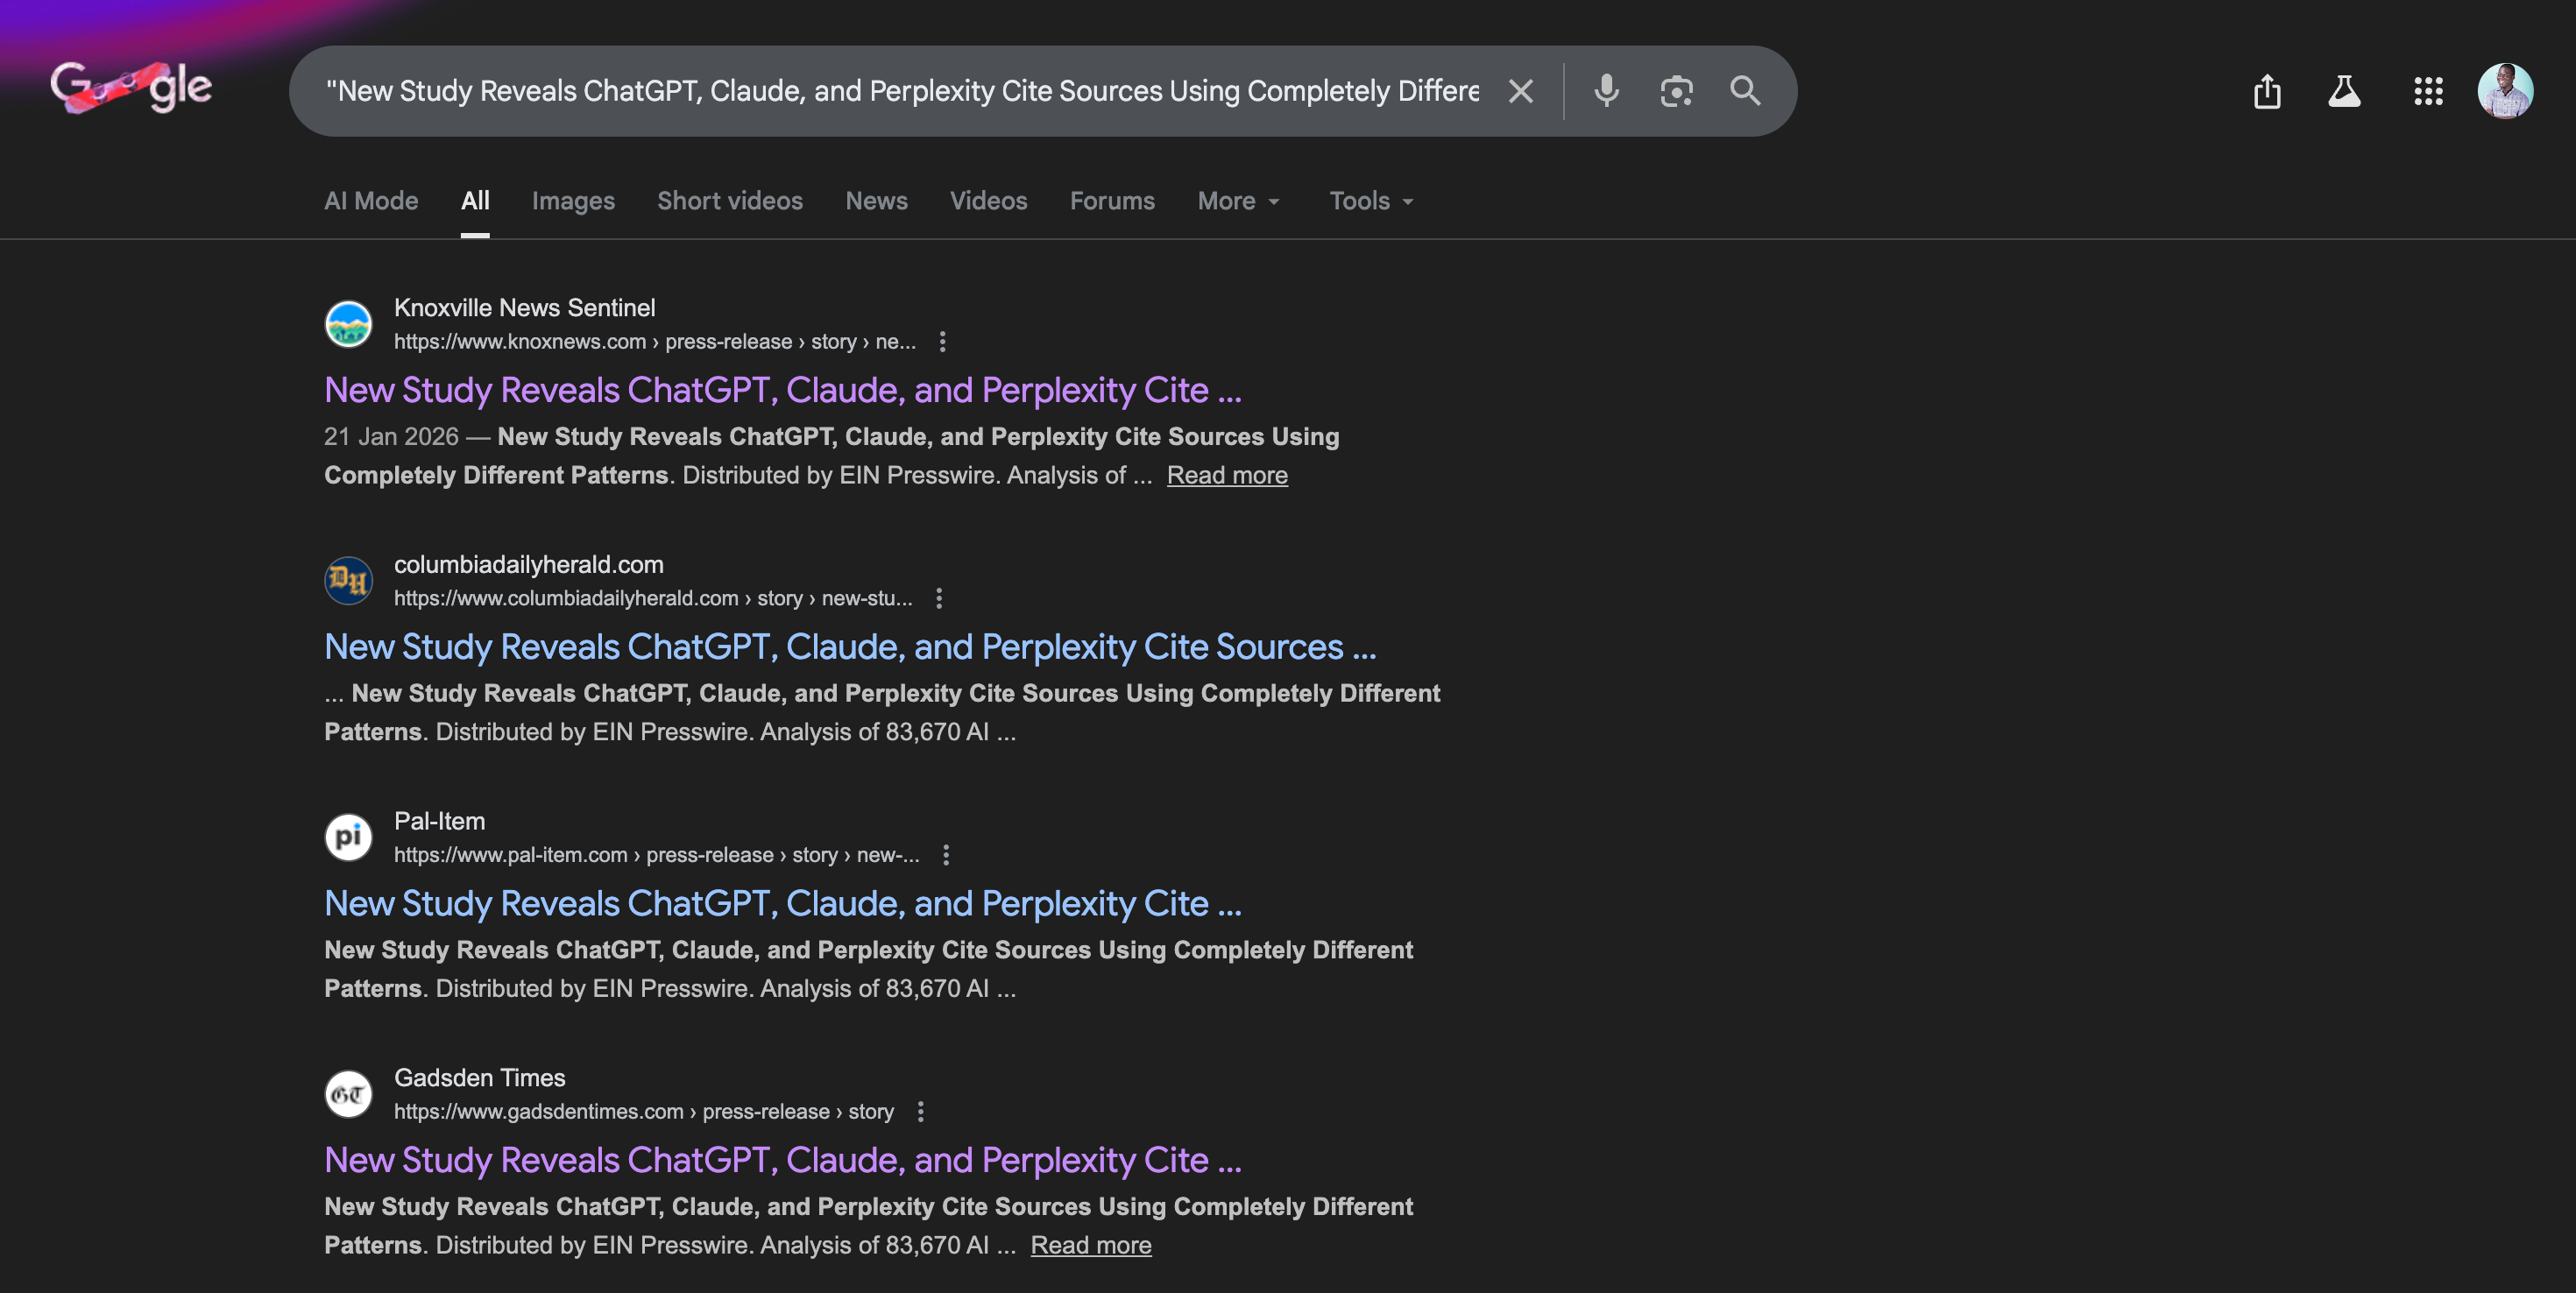
Within days, the story was picked up by 303 outlets, including AP News, FOX affiliates, NBC stations, Gannett newspapers like The Des Moines Register, The Palm Beach Post, The Courier-Journal, and dozens of regional and national publications. I now have backlinks from domains with authority scores that would cost thousands of dollars to acquire through traditional link building.
| Outlet | Link |
|---|---|
| AP News | View |
| Texas Business Times | View |
| Texas Technology Digest | View |
| UK Business Reporter | View |
| Technology News UK | View |
| KETK NBC 56/KFXK FOX 51 | View |
| KVEO NBC 23 | View |
| KFDX NBC 3 | View |
| KDAF CW 33 | View |
| KTSM NBC 9 | View |
| KMID ABC 2 | View |
| KIAH CW 39 | View |
| Lone Star State News | View |
| Texas Industry Journal | View |
| Entertainment Daily Texas | View |
| Austin Daily Sun | View |
| Texas Daily Standard | View |
| UK Herald Tribune | View |
| UK Post Observer | View |
| Breaking News from the United Kingdom | View |
| United Kingdom Globe Dispatch | View |
This post is going to walk you through every single step of how I did it, and more importantly, how you can do the same thing regardless of what industry you are in, whether you have a product that generates data or not, and whether you know how to code.
Why First-Party Data Is the Best Link Building Strategy Nobody Uses
Let me make the case for why this approach is fundamentally superior to every other backlink strategy before we get into the how.
The traditional approach to link building is essentially a sales process. You identify sites you want links from, you find the right person to contact, you craft a pitch, you send it, you follow up, you get ignored, you try again, and maybe after dozens of attempts you land a single link on a single site. The economics are brutal. At best, you are looking at maybe 2-5% response rates on cold outreach, and maybe 10-20% of those responses result in an actual link. So for every 100 emails you send, you might get one or two links. And those links are typically on mid-tier blogs, not major news outlets.
With the data-driven PR approach, you flip the entire dynamic. Instead of chasing publications one by one, you create something inherently newsworthy and then let the distribution network do the work. One press release, distributed through a wire service, gets simultaneously sent to thousands of newsrooms. The publications that find it relevant pick it up. The ones that do not simply ignore it. You are not doing any outreach. You are not building any relationships. You are not crafting any individualized pitches. You write one thing, you press one button, and the backlinks roll in.
The quality of the links is also fundamentally different. When you get a link from AP News or a Gannett newspaper, that is a real editorial placement on a high-authority domain. These are not guest post links on blogs with 500 monthly visitors. These are links from sites that Google considers authoritative sources of information. The SEO value of a single AP News backlink is worth more than a hundred guest post links combined.
But the benefits extend far beyond SEO. When your research gets picked up by major outlets, it establishes you as an authority in your space. It gives you credibility you can reference in sales conversations, on your website, and in future content. It creates a compounding effect where journalists who covered your first study are more likely to cover your second one. And it generates brand awareness among audiences you could never reach through organic content alone.
The only catch, and this is the part where most people give up before they start, is that you need data. Specifically, you need data that tells a story journalists care about. And that is what the rest of this post is about.
Where to Get Data: First-Party Sources
The ideal scenario is that you already have access to unique data through your business. This is first-party data, meaning data you collect directly through your product, your customers, or your operations. It is the most valuable type of data for press releases because nobody else has it. If anyone could access the same data, there is no story.
Here is how I thought about this for my own situation. I run Analyze AI, a platform that tracks how AI search engines like ChatGPT, Claude, and Perplexity cite sources and mention brands. Through our platform, we monitor thousands of AI responses and track every citation each engine makes. This means we have a dataset that literally no one else on earth has: a comprehensive view of which sources each AI engine prefers, how citation patterns differ between engines, and how brand visibility varies across the AI search landscape.
That is the kind of first-party data that makes for a great press release. It is exclusive, it is timely, it is relevant to a massive industry trend (the rise of AI search), and it produces surprising findings that challenge conventional wisdom.
But maybe you do not have a product that generates interesting data. That is fine. Here are the categories of first-party data you might be sitting on without realizing it.
Customer behavior data. If you run any kind of product, you have usage data. How do your users behave? What features do they use most? What patterns emerge over time? A project management tool could analyze what percentage of tasks get completed on time versus late. A CRM could analyze how many touches it takes to close deals across different industries. An email marketing platform could analyze open rates by time of day, day of week, and subject line format. This kind of behavioral data, anonymized and aggregated of course, is exactly what journalists in your industry vertical are hungry for.
Survey data. You do not need an existing product to create first-party data. You can survey your audience, your customers, your social media followers, or even cold audiences using tools like Typeform, Google Forms, or SurveyMonkey. The key is to ask questions that produce surprising answers. "What is your biggest challenge with X?" is boring. "How much revenue did your company lose last year due to X?" is newsworthy because it attaches a dollar figure to a problem. Surveys with 200+ respondents tend to be taken seriously by journalists. Under 100, and you are on shaky ground.
Internal operational data. If you run a services business, you have data about your own operations that might be more interesting than you think. A marketing agency could analyze the results of every campaign they have run over the past year and identify which channels actually drive ROI versus which ones clients think drive ROI. A recruiting firm could analyze how long it takes to fill positions across different industries. A consulting firm could analyze what percentage of recommendations clients actually implement.
Scraped or collected data. If you can code, or if you use tools like Apify, Octoparse, or even just Python with BeautifulSoup, you can collect data from public sources and turn it into original research. Scrape job postings to analyze salary trends. Scrape product listings to compare pricing across competitors. Scrape social media to analyze what topics are trending in a specific niche. The data itself is publicly available, but the analysis and the narrative you build around it are unique to you.
The through-line across all of these is that the data needs to be unique to you. Either nobody else has access to the raw data, or nobody else has bothered to analyze it in the way you are about to. That uniqueness is what makes it newsworthy.
Where to Get Data If You Have Nothing: Government and Public Databases
Here is a secret that most people in content marketing do not know: the United States government and governments around the world publish staggering amounts of data that is completely free to access, and almost nobody uses it for PR purposes. You can build an entire press release strategy around publicly available government data by combining datasets in ways nobody has thought to combine them, or by analyzing trends that nobody has bothered to track.
The trick is not just downloading a CSV file and regurgitating the numbers. The trick is combining multiple data sources to find an angle that is genuinely new.
Here are the most useful government and public databases organized by industry.
For tech and SaaS companies. The Bureau of Labor Statistics (bls.gov) publishes employment data that you can slice by industry, occupation, and geography. If you are in HR tech, you could analyze hiring trends in tech versus non-tech industries over the past 5 years and find the specific moment when the trend reversed. The Census Bureau's Annual Business Survey has data on technology adoption by business size and industry. The Patent and Trademark Office (USPTO) publishes every patent filing, which you can analyze to track innovation trends in your space.
For healthcare and biotech. CMS.gov (Centers for Medicare and Medicaid Services) publishes hospital performance data, spending data, and outcomes data that is mind-bogglingly detailed. The FDA publishes drug approval timelines, adverse event reports, and inspection data. ClinicalTrials.gov has data on every registered clinical trial. The CDC's WONDER database lets you query mortality, natality, and disease data at the county level.
For finance and fintech. The SEC's EDGAR database has every public company's financial filings in structured format. The FDIC publishes bank-level financial data quarterly. The Federal Reserve publishes economic data through FRED (Federal Reserve Economic Data) that covers hundreds of economic indicators. The Consumer Financial Protection Bureau publishes complaint data that you can analyze by company, product type, and issue.
For real estate. The Census Bureau publishes the American Community Survey with housing data at the ZIP code level. Zillow's ZTRAX dataset (if you can get access) has transaction-level data. The Federal Housing Finance Agency publishes house price indices. HUD publishes data on public housing, fair market rents, and voucher usage.
For education. The Department of Education's IPEDS database has institutional-level data on every college and university in the country, including enrollment, graduation rates, financial aid, and expenditures. The College Scorecard has earnings data for graduates by institution and field of study.
For ecommerce and retail. The Census Bureau's Monthly Retail Trade Survey tracks retail sales by category. The International Trade Administration publishes import and export data that you can slice by product category and country.
For anyone. Data.gov is the umbrella portal for all US government datasets, with over 300,000 datasets across every imaginable category. Many other countries have similar portals: data.gov.uk for the UK, data.europa.eu for the EU, and so on.
The approach for using government data is different from first-party data. With first-party data, the story is "we have exclusive data that shows X." With government data, the story is "we analyzed publicly available data in a new way that reveals X." The novelty comes not from the data itself but from the analysis. You are connecting dots that nobody else has connected.
For example, you could combine BLS employment data with Census technology adoption data to show that industries with the highest AI adoption rates are actually hiring more people, not fewer. That contradicts the dominant narrative about AI replacing jobs, which makes it newsworthy. The data is public. The analysis is yours. The angle is original.
Analyzing the Data: Finding the Story in the Numbers
Having data is necessary but not sufficient. The difference between a press release that gets picked up by 300 outlets and one that gets picked up by zero is entirely about the analysis. Specifically, it is about finding the surprising thing in your data.
Here is the framework I use. I call it the Expectation Gap framework, and it works like this: for every data point you find, ask yourself what the average person in your industry would expect the answer to be, and then look for the cases where the actual answer is dramatically different from the expectation.
Let me show you how this worked with my AI citation study. Before I ran the analysis, most people in the marketing world assumed that AI search engines were roughly interchangeable. ChatGPT, Claude, Perplexity, they all do similar things, so they probably cite similar sources, right? That was the expectation.
The reality was dramatically different. ChatGPT cited Wikipedia for 12.1% of its sources. Claude cited Wikipedia exactly twice out of 1,665 citations, which works out to 0.1%. Perplexity cited Wikipedia zero times. That is a 121x difference between ChatGPT and Claude on a single source type. Nobody expected that. That gap between expectation and reality is what makes it a story.
The same pattern held for LinkedIn. ChatGPT cited LinkedIn 900 times. Claude and Perplexity cited it zero times. For B2B marketers who have been investing heavily in LinkedIn content thinking it would help with AI visibility, this finding is a bucket of cold water on their strategy. It is actionable, it is surprising, and it is backed by hard numbers.
Here is the practical process for finding these expectation gaps in your own data.
Start by doing an exploratory analysis. If you can code, use Python with pandas. If you cannot, use Google Sheets or Excel. Load your data and start looking at distributions, averages, percentages, and trends over time. Do not go in with a hypothesis. Just look at the data and let it tell you what is interesting.
For the non-coders, Claude, ChatGPT, or any capable AI tool can analyze data for you. Upload a CSV to Claude and ask it to find surprising patterns, outliers, and trends. Ask it to compare groups and identify where the differences are largest. Ask it to calculate percentages and rank things from highest to lowest. You do not need to know a single line of code to do a thorough data analysis in 2026.
For the coders, here is a rough workflow. Load the data into a pandas DataFrame. Start with descriptive statistics: value counts, group-by aggregations, and cross-tabulations. Then move to comparisons: how does Group A differ from Group B? Where are the biggest deltas? Look for anything where the ratio between two groups is 2x or greater, or where a percentage is above 50% or below 10%. Those extremes are where the stories live.
Once you have a list of interesting findings, rank them by three criteria. First, surprise factor: how unexpected is this finding compared to what most people would assume? Second, relevance: does this finding matter to a large audience? A finding about a niche of a niche is not going to get press pickup. Third, actionability: does this finding imply that someone should change their behavior? The best press-worthy findings are ones where someone reads the headline and immediately thinks "oh, I need to rethink my approach to X."
In my case, the Wikipedia finding scored high on all three. It was surprising (nobody expected a 121x gap), it was relevant (millions of marketers are trying to optimize for AI search), and it was actionable (if you have been investing in Wikipedia optimization, you now know it only matters for ChatGPT).
Aim for three to five strong findings. You need one headline finding that is your lead, and then two to four supporting findings that round out the story and give the press release substance.
Finding the Angle: What Makes Journalists Care
This is the step where most data studies die. You have the data. You have the findings. But you have not figured out why a journalist would care. And "it's interesting" is not a reason. Journalists get pitched hundreds of stories a week. They need a reason to cover yours instead of the other 99.
There are five angles that consistently get press pickup for data studies.
The "everyone is wrong" angle. This is the most powerful angle and the one I used for my AI citation study. Find a widely held belief in your industry and show, with data, that it is wrong. "Marketers assume AI engines are interchangeable. They're not. Here's the data." The reason this works is that it gives the journalist a ready-made narrative: the contrarian story. Readers love being told that something they believed was wrong, especially when the proof is specific and credible.
The "it's worse than you think" angle. Take a known problem and show that the actual numbers are more severe than people realize. "Companies are losing more than they realize to AI-driven brand misrepresentation" or "employee turnover costs 3x more than the widely cited estimates when you account for X." This works because it creates urgency. It tells the reader they should be paying more attention to a problem they have been ignoring.
The "first ever" angle. If your dataset is genuinely novel, lean into the fact that this analysis has never been done before. "First comprehensive analysis of AI citation patterns across all three major engines." The word "first" is magic in press releases because it inherently implies newsworthiness. If something has never been studied before, that alone makes it worth covering.
The "trend just changed" angle. If your data shows a shift over time, especially a recent one, that is inherently newsworthy. "AI citation patterns shifted dramatically in Q4 2025" or "remote work adoption reversed course for the first time since 2020." Journalists love trend stories because they feel timely and relevant, and they give readers the sense that they are learning about something that is happening right now.
The "David vs. Goliath" angle. If your data shows that smaller players are outperforming larger ones, or that underdogs are winning in unexpected ways, that is a story journalists love to tell. "Independent blogs outperform Fortune 500 content in AI citations 3:1" or "companies with fewer than 50 employees are adopting AI at twice the rate of enterprises."
Pick the angle that best fits your strongest finding and build the entire press release around it. Do not try to cover every angle. A press release with a clear, singular narrative gets more pickup than one that tries to tell five different stories.
Writing the Press Release: The Anatomy of a Story That Gets Picked Up
This is where most people fumble, and I understand why. If you have never written a press release before, it feels like a foreign format. It has its own conventions, its own rhythm, and its own unwritten rules. But once you understand the structure, it is actually quite formulaic. And I mean that in the best possible way, because the formula works.
Here is the exact structure I used for my AI citation study, broken down section by section.
The headline. Your headline needs to accomplish three things: include the most surprising number from your study, name the entities that people will recognize, and create tension or conflict. My headline was: "New Study Reveals ChatGPT, Claude, and Perplexity Cite Sources Using Completely Different Patterns." The three brand names (ChatGPT, Claude, Perplexity) are the recognizable entities. "Completely Different Patterns" is the tension. The implied surprise is that everyone assumed these engines were similar, and they are not.
If I had instead titled it "Analyze AI Publishes Research on AI Citation Patterns," it would have gotten zero pickups because nobody knows who Analyze AI is, and "AI citation patterns" does not create any tension. The headline is not about you. It is about the finding.
The subheadline. This is where you add the credibility of your dataset. "Analysis of 83,670 AI citations reveals Wikipedia, LinkedIn, and brand-owned content are treated dramatically differently across AI search engines." The specific number (83,670) is doing heavy lifting here. It tells the journalist that this is not a back-of-the-napkin analysis. It is a rigorous study with a large dataset.
The lead paragraph. The first paragraph needs to state the single most important finding in plain language, include the sample size and time period, and tie the finding to a trend that is already in the news. Here is roughly how mine read: "A new analysis of 83,670 citations from ChatGPT, Claude, and Perplexity reveals that the three major AI search engines cite dramatically different sources, raising questions about whether marketers should treat AI search as a single channel."
Notice what this paragraph is doing. It leads with the finding (different citation patterns), establishes credibility (83,670 citations), and ties to a bigger trend (the debate over how marketers should approach AI search). It also implies a controversy: should marketers treat these engines the same or differently? That implied question is what hooks the journalist.
The body with key findings. This is where you lay out your three to five findings, each with specific numbers. Present them in order from most surprising to least surprising. Use simple tables or data points that are easy to scan. Remember, journalists are going to skim this. Make it impossible to skim without encountering a specific, quotable number.
For example, one of my findings was presented as: "Wikipedia citation rates differ by over 100x between engines. ChatGPT uses Wikipedia for 12.1% of its citations. Claude uses it for just 0.1%. Perplexity does not cite Wikipedia at all." That is three sentences, each with a specific number, each building on the previous one. A journalist can lift any of those sentences directly into their coverage.
The quote. Every press release needs a quote from someone at your company, and this quote needs to do something that the data cannot do on its own: provide the "so what." The data shows that citation patterns differ. The quote explains why that matters and what someone should do about it.
Here is the quote I used: "Marketers have been obsessing over Reddit lately, but our data shows LinkedIn is actually more interesting—ChatGPT cited it 900 times while Claude and Perplexity cited it zero times. A Wikipedia strategy that works for ChatGPT will completely miss Claude and Perplexity users. Brands need to track and optimize for each engine separately."
Notice the structure. It opens by referencing a current trend (Reddit obsession) to show timeliness. It pivots to a specific data point (LinkedIn citations). And it closes with a clear recommendation (optimize for each engine separately). The quote is designed to be liftable. A journalist can drop this into their article as-is.
The methodology. Briefly explain how you collected the data, the time period covered, and the sample size. This section is for credibility. It tells the journalist that this is real research, not made-up numbers. Keep it to two or three sentences.
The boilerplate. One or two sentences about what your company does. This is the only place in the entire press release where you mention your product. If your boilerplate is longer than three sentences, you are being too promotional. Remember, the press release is about the data, not your product. The product mention is a bonus, not the point.
The media contact. Your name, title, email, and website. Keep it simple.
One more thing about the writing itself. Press releases have a specific tone that is different from blog writing, marketing copy, or academic writing. The tone is confident but neutral. You are stating facts, not making sales pitches. You do not say "our groundbreaking research." You say "the analysis reveals." You do not say "this proves that brands need our product." You say "the findings suggest that marketers may need to reconsider their approach." The understatement is deliberate. Journalists trust sources that let the data speak for itself and they distrust sources that oversell.
Distributing the Press Release: Why I Used EIN Presswire
There are dozens of wire services out there, and they range from free to absurdly expensive. PR Newswire and Business Wire are the blue-chip options, and they charge $500 to $2,000+ per release depending on distribution scope. GlobeNewswire sits in the middle. And then there are the budget options like EIN Presswire, Newswire, and others.
I used EIN Presswire for a few reasons.
First, the cost. EIN Presswire's basic distribution starts at $99 per release. For a bootstrapped startup, this is a fundamentally different proposition than spending $1,500 on PR Newswire. And as my results showed, the $99 spend generated 303 pickups including AP News. The ROI on that is almost comical.
Second, the distribution network. EIN Presswire syndicates to Google News, Bing News, and a network of industry-specific news sites. More importantly, they have partnerships with major outlets. My release was picked up by AP News, which then gets syndicated further to AP's own network of thousands of local newspapers and broadcast outlets. That single AP pickup is probably responsible for a large chunk of the 303 total placements.
Third, the process is dead simple. You create an account, paste your press release into their editor, select your industry categories (I chose Technology and Marketing/Advertising), add any multimedia assets, and submit. There is an editorial review process that takes a few hours, and then the release goes live. Total time from submission to distribution was less than 24 hours.
Here are some tactical tips for maximizing your EIN Presswire distribution.
Timing matters. Publish Tuesday through Thursday, between 8 AM and 10 AM Eastern time. Monday is too crowded with weekend catch-up. Friday is a dead zone because journalists are already mentally checked out. The Tuesday to Thursday window gives your release the best chance of being seen when newsrooms are actively looking for stories.
Category selection matters. EIN Presswire lets you choose industry categories for distribution. Pick two to three categories that are most relevant. For my AI citation study, I chose Technology and Marketing/Advertising. This ensures your release reaches the journalists who actually cover your topic, not just random news aggregators.
Multimedia increases pickup. If you have charts, graphs, or infographics from your data analysis, include them. Releases with visuals get higher engagement because they give journalists ready-to-use assets for their coverage. I did not include multimedia for my release, and I still got 303 pickups. But I suspect the number would have been even higher with a chart of the Wikipedia citation gap.
The headline is everything. EIN Presswire shows your headline in their editorial queue and in the feeds that journalists monitor. If the headline does not immediately communicate a surprising finding, journalists will scroll past it. Spend more time on your headline than on any other part of the release.
The Results: 303 Pickups, AP News, and What That Actually Means
Let me break down what happened after I hit publish.
Within the first 24 hours, the release was live on EIN Presswire's own network, which includes dozens of industry-specific news portals like Business News Today, Technology Today, and various vertical feeds. These are the guaranteed placements that come with any EIN distribution.
Within 48 hours, the story started getting picked up by real news outlets. AP News was the big one. When your story hits AP, it gets automatically syndicated to AP's partner network, which includes most local newspapers and many broadcast stations in the United States. This is how I ended up on sites like The Des Moines Register, The Palm Beach Post, The Burlington Free Press, The Courier-Journal, Lansing State Journal, Springfield News-Leader, and dozens of other Gannett newspapers.
The FOX and NBC affiliate pickups came through a similar mechanism. WDAF FOX 4, WSPA CBS 7, WIAT CBS 42, KETK NBC 56, KVEO NBC 23, KFDX NBC 3, KTSM NBC 9, WDTN NBC 2, WHO NBC 13, and WIVB CBS 4 all published the story. These are local TV station websites that syndicate wire content.
Then there were the regional and international outlets. Texas Business Times, UK Business Reporter, Technology News UK, Central Europe Online, The Global European, and World Online News Reports all carried the story.
All told, 303 unique URLs carrying my press release. Each one is a backlink to tryanalyze.ai. Each one is on a real news domain with established authority. And each one cost me approximately 33 cents ($99 divided by 303).
Compare that to the cost of acquiring a single backlink from AP News through traditional means. You literally cannot do it. AP News does not accept guest posts. They do not sell links. The only way to get a link from AP is to have a newsworthy story. And that is exactly what a data-driven press release gives you.
But the backlinks are almost a secondary benefit. The primary benefit is the brand visibility. When someone Googles "ChatGPT Claude Perplexity citation patterns," they see my study on dozens of authoritative news sites. That is the kind of search presence you cannot buy with SEO alone.
The Full Playbook: Step by Step from Zero to Pickup
Let me compress everything above into a step-by-step workflow you can execute.
Step 1: Identify your data source. If you have a product, look at what data it generates. If you do not have a product, look at government databases, run a survey, or scrape public data. The data needs to be either exclusive to you or analyzed in a way nobody has done before.
Step 2: Do an exploratory analysis. Load the data into Google Sheets, Excel, or Python. Look for surprises, outliers, and big gaps between what people would expect and what the data actually shows. If you cannot code, upload the CSV to Claude or ChatGPT and ask it to find the most interesting patterns. Spend at least two to three hours on this. The quality of your analysis determines the quality of your press release.
Step 3: Identify three to five key findings. Rank them by surprise factor, relevance, and actionability. Pick the most surprising finding as your lead. The rest become supporting points.
Step 4: Choose your angle. Is this an "everyone is wrong" story? An "it's worse than you think" story? A "first ever" story? Pick one angle and build the narrative around it.
Step 5: Write the press release. Follow the structure from the section above: headline with specific numbers and recognizable names, subheadline with dataset size, lead paragraph tying to a trend, body with key findings and tables, quote explaining the "so what," methodology section, boilerplate, and contact info. Keep the total length under 800 words. Shorter is better.
Step 6: Distribute through a wire service. For most bootstrapped startups, EIN Presswire at $99 is the best value. Submit on Tuesday, Wednesday, or Thursday morning Eastern time. Select two to three relevant industry categories. Include charts or infographics if you have them.
Step 7: Track and amplify. After distribution, monitor Google News for pickups. Share the AP News or highest-authority pickup on your social channels and in your newsletter. Reference the study in future content. Use the press coverage in sales conversations and on your website's "As Seen In" section.
Step 8: Repeat quarterly. One press release is good. A quarterly cadence of data-driven releases builds compounding authority. Each release makes the next one more likely to get picked up because journalists start to recognize you as a reliable source of data.